Distributions within shapes#
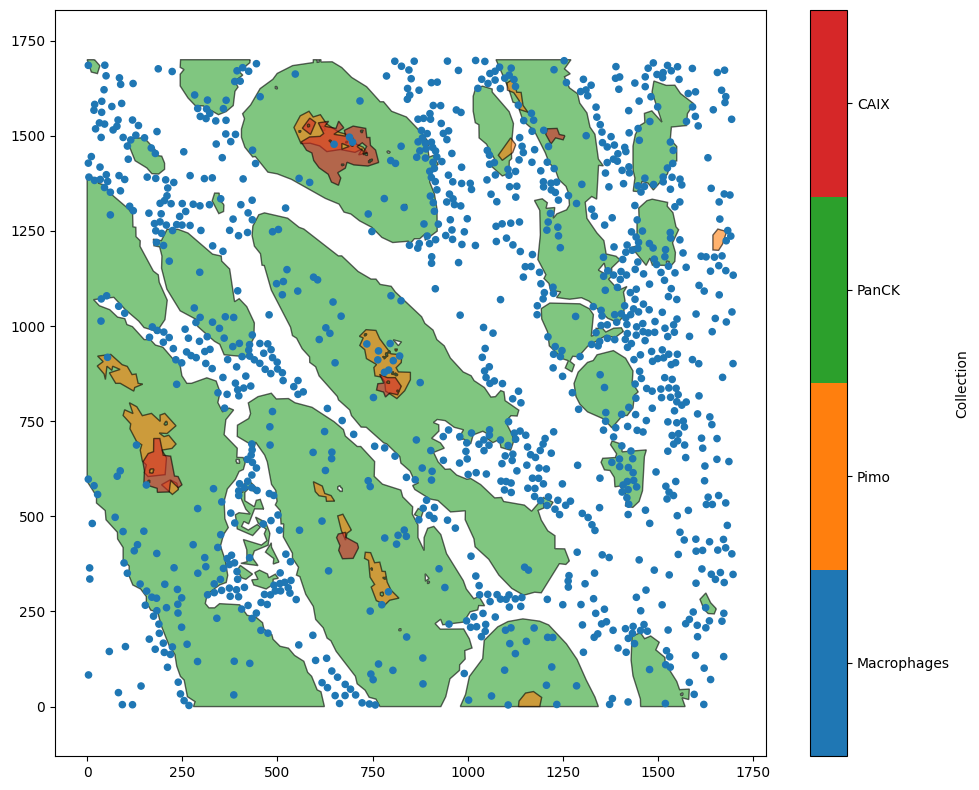
The distribution generation functions - for instance, ms.distribution.kernel_density_estimation or ms.distribution.generate_distribution - also play nicely with MuSpAn’s boundaries keywords. For example, let’s load in the Macrophage-Hypoxia-ROI dataset and look at the density of macrophages in the tumour.
[1]:
# Import necessary libraries for analysis
import muspan as ms
import matplotlib.pyplot as plt

# Load the example domain dataset
domain = ms.datasets.load_example_domain('Macrophage-Hypoxia-ROI')

# Visualise the loaded domain
ms.visualise.visualise(domain)
MuSpAn domain loaded successfully. Domain summary:
Domain name: Example ROI from Pugh/Macklin H&N cancer hypoxia data
Number of objects: 1163
Collections: ['Macrophages', 'Pimo', 'PanCK', 'CAIX', 'Simplified boundaries']
Labels: []
Networks: []
Distance matrices: []
[1]:
(<Figure size 1000x800 with 2 Axes>, <Axes: >)
First, let’s see what the kernel density estimation (KDE) looks like across the whole ROI.
[2]:
# Calculate the KDE for all macrophages across the entire domain
kde_all = ms.distribution.kernel_density_estimation(
    domain,
    population=('Collection', 'Macrophages'),
    mesh_step=5
)

# Calculate the KDE for macrophages within the tumour boundaries
kde_tumour = ms.distribution.kernel_density_estimation(
    domain,
    population=('Collection', 'Macrophages'),
    include_boundaries=('Collection', 'PanCK'),
    mesh_step=5
)

# Create a figure with two subplots
fig, axes = plt.subplots(1, 2, figsize=(10, 5))

# Visualise the KDE for all macrophages
ms.visualise.visualise_heatmap(domain, kde_all, ax=axes[0])
axes[0].set_title('All macrophages')

# Visualise the KDE for macrophages within the tumour
ms.visualise.visualise_heatmap(domain, kde_tumour, ax=axes[1])
axes[1].set_title('Macrophages in tumour only')

# Adjust layout for better spacing
plt.tight_layout()
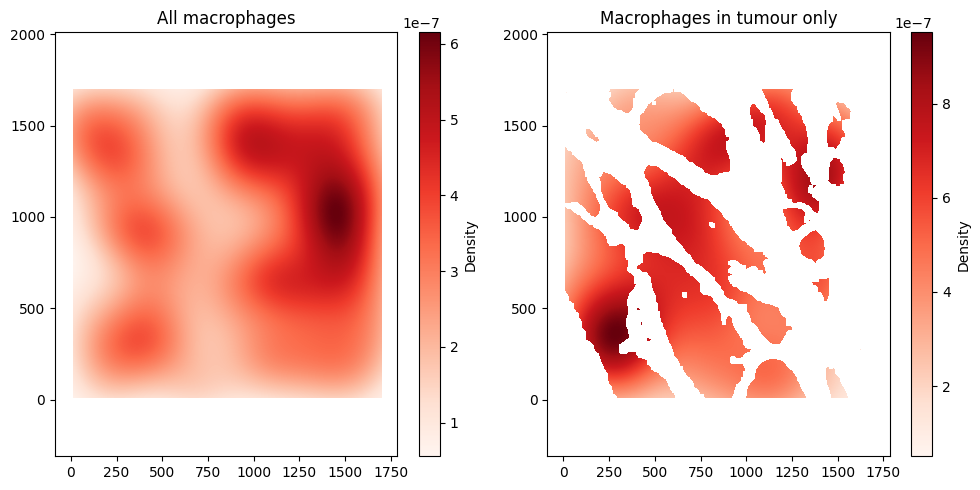
When we don’t take into account the tumour/stroma boundary, we can see that most of the density of macrophages is in the top right of the ROI. However, using the include_boundaries argument shows that the tumour island with the highest density of macrophages is actually towards the bottom left of the ROI.