Combining queries: query containers#
In the previous example, we saw how we can use ms.query.query() to make a query that evaluates to True or False for each object, and that MuSpAn can use to return a list of all objects for which this is True. Let’s load the mouse colon data again and look at a couple of queries.
[1]:
# Import necessary libraries
import muspan as ms
import matplotlib.pyplot as plt
import numpy as np

# Load the example domain data
domain = ms.datasets.load_example_domain('Xenium-Healthy-Colon')
MuSpAn domain loaded successfully. Domain summary:
Domain name: Xenium-Healthy-Colon
Number of objects: 74174
Collections: ['Cell boundaries', 'Nucleus boundaries', 'Transcripts']
Labels: ['Cell ID', 'Transcript Counts', 'Cell Area', 'Cluster ID', 'Nucleus Area', 'Transcript', 'Transcript ID']
Networks: []
Distance matrices: []
Let’s suppose we’ve identified a particular cell of interest (e.g., by exploring the data in Xenium explorer), with the ID ‘dfbfdjho-1’, and we want to plot the location of all ‘Sox9’ transcripts within the boundary of this cell.
The Boolean statements we’re going to need here are:
A: The label ‘Cell ID’ is ‘dfbfdjho-1’
B: Collection is ‘Cell boundaries’
C: Collection is ‘Transcripts’
D: The label ‘Transcript ID’ is ‘Sox9’
…and in order to get all these objects together, we want to ask for a query that gets all objects meeting the criteria A AND (B OR (C AND D)). Statements A-D can be written using the query logic that we’ve already seen - in fact, the relevant queries are:
[2]:
# Define the queries for each condition

# Query A: The label 'Cell ID' is 'dfbfdjho-1'
query_A = ms.query.query(domain, ('label', 'Cell ID'), 'is', 'dfbfdjho-1')

# Query B: Collection is 'Cell boundaries'
query_B = ms.query.query(domain, ('collection',), 'is', 'Cell boundaries')

# Query C: Collection is 'Transcripts'
query_C = ms.query.query(domain, ('collection',), 'is', 'Transcripts')

# Query D: The label 'Transcript ID' is 'Sox9'
query_D = ms.query.query(domain, ('label', 'Transcript ID'), 'is', 'Sox9')
In order to ask our more complex query, we’re going to need to combine these queries together. MuSpAn provides a tool for this: the query container. A query container is actually a very simple object: it takes in exactly two query-like objects, and combines them using one of the operators ‘AND’, ‘OR’, or ‘AND NOT’. Let’s make a ms.query.query_container() that asks for C AND D, i.e., that gets all Sox9 transcripts.
[3]:
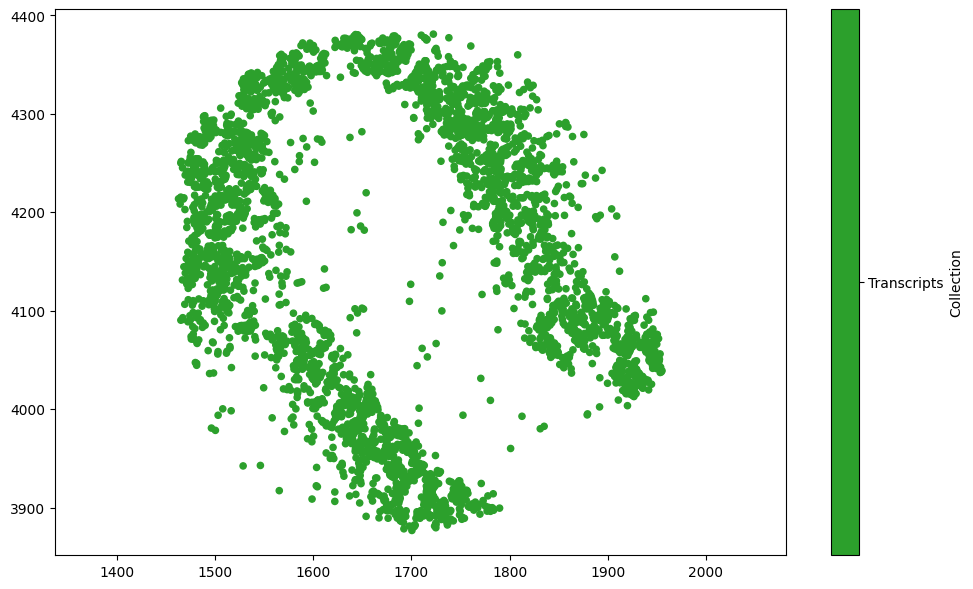
# Combine Query C and Query D using a query container to get all Sox9 transcripts
query_C_and_D = ms.query.query_container(query_C, 'AND', query_D)

# Plot the location of all Sox9 transcripts within the boundary of the specified cell
plt.figure(figsize=(10, 6))
ms.visualise.visualise(domain, ax=plt.gca(), objects_to_plot=query_C_and_D)
[3]:
(<Figure size 1000x600 with 2 Axes>, <Axes: >)
We can keep combining queries together to get to our complex target query, A AND (B OR (C AND D)), by using our query container inside another one:
[4]:
# Combine Query B and Query C_and_D using a query container with 'OR' operator
query_B_or_CandD = ms.query.query_container(query_B, 'OR', query_C_and_D)

# Combine Query A and Query_B_or_CandD using a query container with 'AND' operator to get the final query
final_query = ms.query.query_container(query_A, 'AND', query_B_or_CandD)

# Print the final query to see the combination of queries
print(final_query)
(value is dfbfdjho-1) AND ((collection value is 0) OR ((collection value is 2) AND (value is Sox9)))
As queries get more and more complex, we can always use print to remind us what combination of queries the query container contains. Let’s take a look at the final plot:
[5]:
# Create a new figure with specified size
plt.figure(figsize=(10, 6))

# Visualize the final query results, coloring objects by 'Transcript ID'
ms.visualise.visualise(domain, ax=plt.gca(), objects_to_plot=final_query, color_by='Transcript ID')
[5]:
(<Figure size 1000x600 with 2 Axes>, <Axes: >)
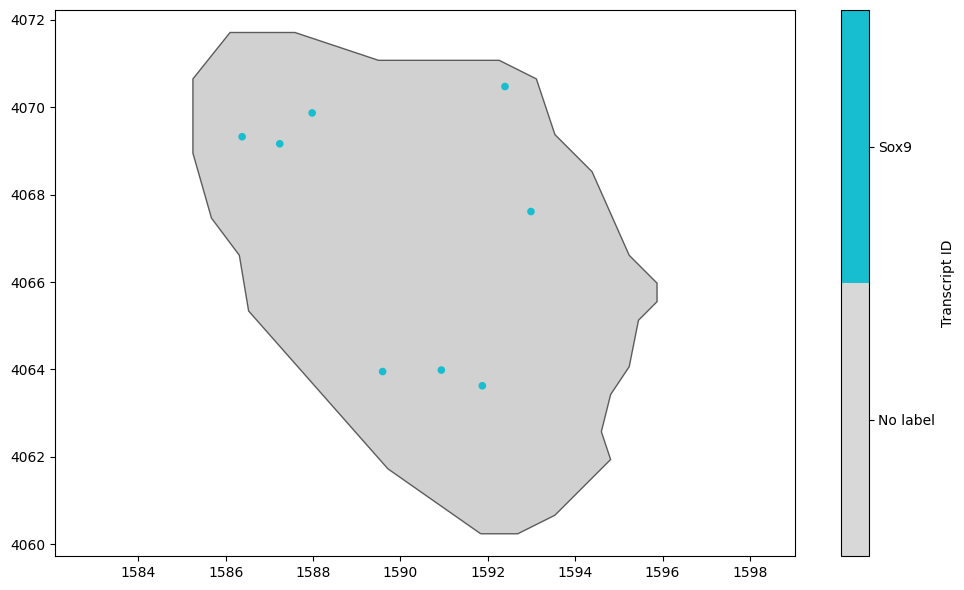
Notice that the objects identified by a query don’t all have to be the same type - in this example, the same query final_query identifies a shape and 8 points.
Queries aren’t just useful for visualisation, they’re also a fundamental part of conducting spatial analysis. We can keep all of our data from one image within a single MuSpAn domain, and conduct different analyses on a subset of points. This is particularly useful for analysing multiplex imaging data, when we may have dozens of different cell types present, but only want to conduct a pairwise analysis between two cell types of interest. MuSpAn’s query structure means that we only need to write a query identifying a population of interest once, and this query can then be passed into visualisation and analysis tools ‘on the fly’ to allow a targeted spatial analysis (see later tutorials).