Converting shapes into points 2: Decomposing a shape to its vertices#
It might be the case where we have some shape-like object in our domain where we’d like to use vertices defining the boundaries of the shape to be their own objects. In this instance, we call this decomposing the shape and can be done through our convert_objects method in the domain class.
[1]:
# Import the muspan module
import muspan as ms
# Load the example domain dataset
example_domain = ms.datasets.load_example_domain('Macrophage-Hypoxia-ROI')
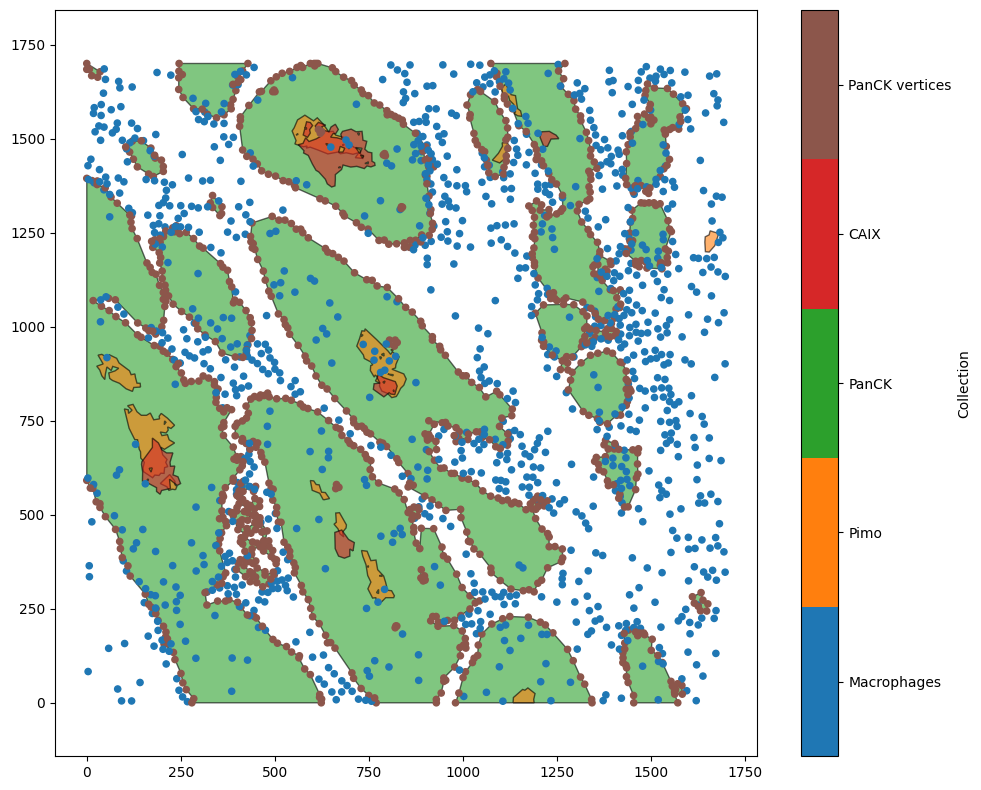
# Visualise the example domain
ms.visualise.visualise(example_domain)
MuSpAn domain loaded successfully. Domain summary:
Domain name: Example ROI from Pugh/Macklin H&N cancer hypoxia data
Number of objects: 1163
Collections: ['Macrophages', 'Pimo', 'PanCK', 'CAIX', 'Simplified boundaries']
Labels: []
Networks: []
Distance matrices: []
[1]:
(<Figure size 1000x800 with 2 Axes>, <Axes: >)

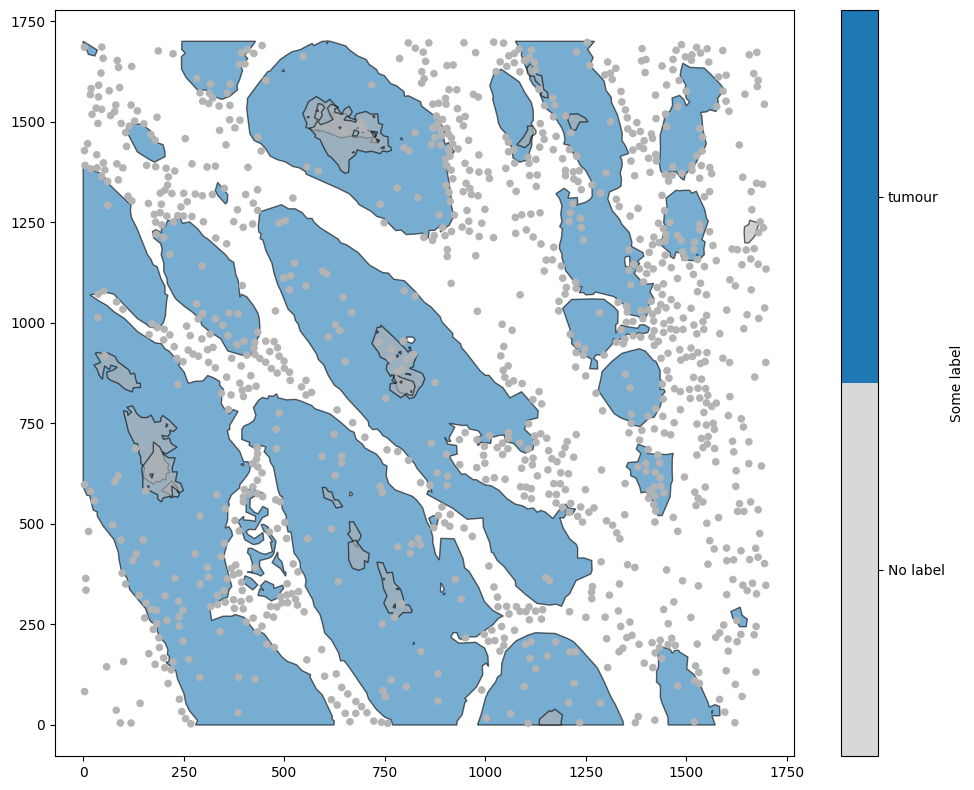
As every vertex is associated with only one shape (it’s parent object), all label data is inherited when we convert shapes into vertices. To demonstrate this, we’ll quickly add some labels to the ‘PanCK’ objects.
[2]:
# Query the IDs of 'PanCK' objects in the example domain
ids_of_panCK = ms.query.return_object_IDs_from_query_like(example_domain, ('collection', 'PanCK'))

# Add labels to the 'PanCK' objects for demonstration purposes
example_domain.add_labels('Some label', ['tumour'] * len(ids_of_panCK), ids_of_panCK)

# Visualise the example domain with the new labels
ms.visualise.visualise(example_domain, color_by='Some label')
[2]:
(<Figure size 1000x800 with 2 Axes>, <Axes: >)
Now we have some labels on the ‘PanCK’ objects, we’ll convert the ‘PanCK’ into vertices using the convert_objects method in the domain class. In particular, we’ll need to set the object type to ‘point’ and conversion method to ‘vertices’.
[3]:
# Convert 'PanCK' objects into vertices
# We set the object type to 'point' and the conversion method to 'vertices'
example_domain.convert_objects(
    population=('collection', 'PanCK'),
    collection_name='PanCK vertices',
    object_type='point',
    conversion_method='vertices'
)
Let’s see what these vertices looks like.
[4]:
# Visualise the example domain after converting 'PanCK' objects into vertices
ms.visualise.visualise(example_domain)
[4]:
(<Figure size 1000x800 with 2 Axes>, <Axes: >)
Great, there is now a point-like object at every vertex of a ‘PanCK’ shape. We can also see that the labels from ‘PanCK’ have been inherited to the newly generated vertices.
[5]:
# Visualise the example domain with the inherited labels from 'PanCK' objects
ms.visualise.visualise(example_domain, color_by='Some label')
[5]:
(<Figure size 1000x800 with 2 Axes>, <Axes: >)
